

Western Australia’s unemployment rate and population growth have continued to taper, according to data released today. CCIWA Senior Economist Sam Collins explains.
Unemployment rate stays low
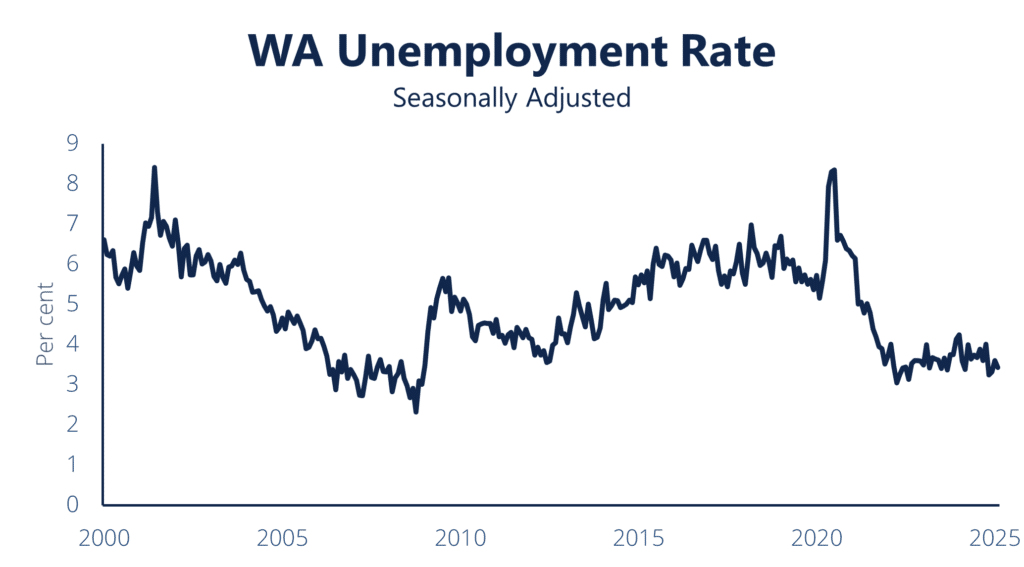
Chart 1
Labour force data shows WA’s unemployment rate remains low, edging down in February to 3.4% from 3.6% in January – the lowest of any state across the country (Chart 1).
Notably, WA was the only state to record employment growth over the month, with an additional 5,100 people finding work. This was driven by a rise in part time employment of 7,600 people, offsetting a 2,600 person decline in full time jobs.
The number of unemployed people also fell by 2,900, contributing to the drop in the unemployment rate. At the same time, the underemployment rate (the proportion of those who want to be working more hours) also eased from 5.8% to 5.6%, still well below the 9%+ levels seen before the pandemic.
Such a low underemployment rate suggests that workers continue to mostly be able to find the amount of work that they want, which is unsurprising given the strong demand for labour.
These figures reinforce WA’s persistently tight labour market, particularly when compared with the rest of the country.
Our latest views and forecasts for the WA labour market can be found in our most recent edition of Outlook, released here on Monday.
Population growth softens further

Chart 2
The latest population data indicates WA’s population growth continued to ease in the September 2024 quarter, with annual growth slowing to 2.5%, down from 2.8% in June (Chart 2).
This marks the fourth consecutive quarter of decline since growth peaked at 3.4% in September 2023, when overseas migration was at its current height.
Despite overseas migration almost halving since then, it remains the dominant driver of population growth for the State.
Net overseas migration accounted for almost 70% of the population increase over the quarter, equating to just over 11,500 people.
CCIWA expects population growth to ease a little further over the coming year as overseas migration softens slightly, after which growth should stabilise.
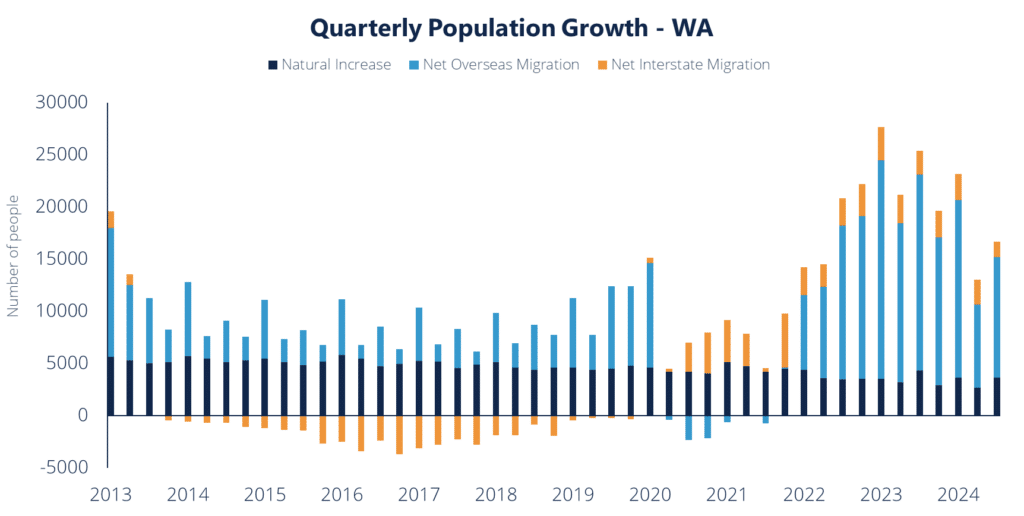
Chart 3
CCIWA’s Economic reports are available exclusively to CCIWA Complete, Advantage and Corporate Members. For more see CCIWA’s Economic Insight page.